

Quickly assess your most valuable B2B features
Having an understanding of which features are the most valuable can help you focus your investments on the features that drive monetization, identify which features should be showcased early in a user journey (e.g., in an onboarding flow / first user session), and identify engagement metrics that are leading indicators of churn.
There are a lot of approaches to establishing your most valuable features, but many fall prey to common shortfalls:
Assuming your customers find value where you personally find value
Assuming the most highly used feature is the most valuable feature
Assuming the feature that receives the most requests for improvement is the most valuable feature
A simple approach that works at scale is to correlate feature usage to renewal actions. The results of the correlation and overall feature engagement can be plotted on a simple 2×2:
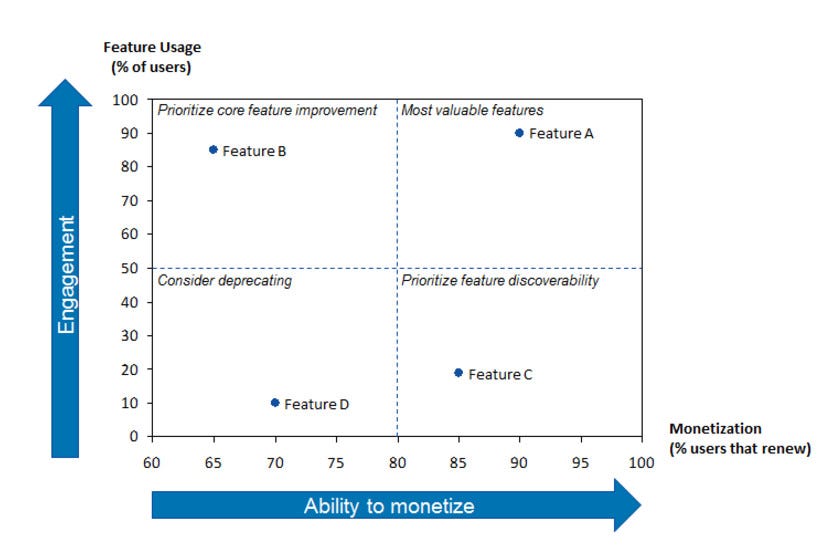
From the illustrative 2×2 above, we see that features fall into one of four categories:
Feature A (High usage, positive correlation with monetization): These are likely your most valuable features. Ensure these features are prioritized when resolving bugs and future enhancements.
Feature B (High usage, negative correlation with monetization). Customers use them, so there is a need, but they appear to correlate negatively once used. These features appear to fall short of your users’ expectations and cause them to renew at a lower rate; you should investigate if the feature experience is broken.
Feature C (Low usage, positive correlation with monetization): The minority of users that discover this feature renew at a higher than average rate, so investing in discoverability of this feature could potentially drive additional monetization.
Feature D (Low usage, negative correlation with monetization): This is likely your least valuable feature that is not highly used and, when used, correlates negatively with renewal rates. Consider deprecating the feature to allow you to focus on the other quadrants.
Building the 2×2 is straightforward with modern statistical software
On your first axis, you set up a logistical regression with renewal as the dependent variable and your key features (e.g., page views or actions) as independent variables
On your second axis, you lay out the overall engagement of that feature, e.g., % of users that use that feature on a daily/weekly/monthly basis
There are multiple benefits to the regression approach: It is easy to do with modern statistical software (e.g., R), works at scale (as opposed to customer interviews) and it does not require an initial hypothesis. A few words of caution on running the regression:
As with regular linear regressions, this analysis will only show correlation, not causation. Consider if the results make sense and triangulate with other qualitative sources such as customer interviews, NPS results, etc.
Many factors beyond engagement drive willingness to pay, including the price paid for your product and tenure on the product. At a minimum, you should look at cohorts of similar tenured users, for example, all of your users coming up for their 1st monthly or 1st annual renewal.
You must remove engagement tied to renewing or canceling to get meaningful results. For example, your site's cancellation confirmation page view will always negatively correlate with renewals.