

Beyond average: Embracing your outlier customers
Recently, the Scandinavian online auction site Lauritz.com got into hot water when a newspaper found the bidding behavior on the site to be suspiciously lopsided. The newspaper scraped the auction site and revealed that while the average user participated in 3 auctions on Lauritz.com, the 10 most active users participated in 370,000 auctions, roughly 10% of all auctions (story here). The story serves as a good reminder that online user behavior is rarely normally distributed and that looking at average user engagement is not very meaningful.
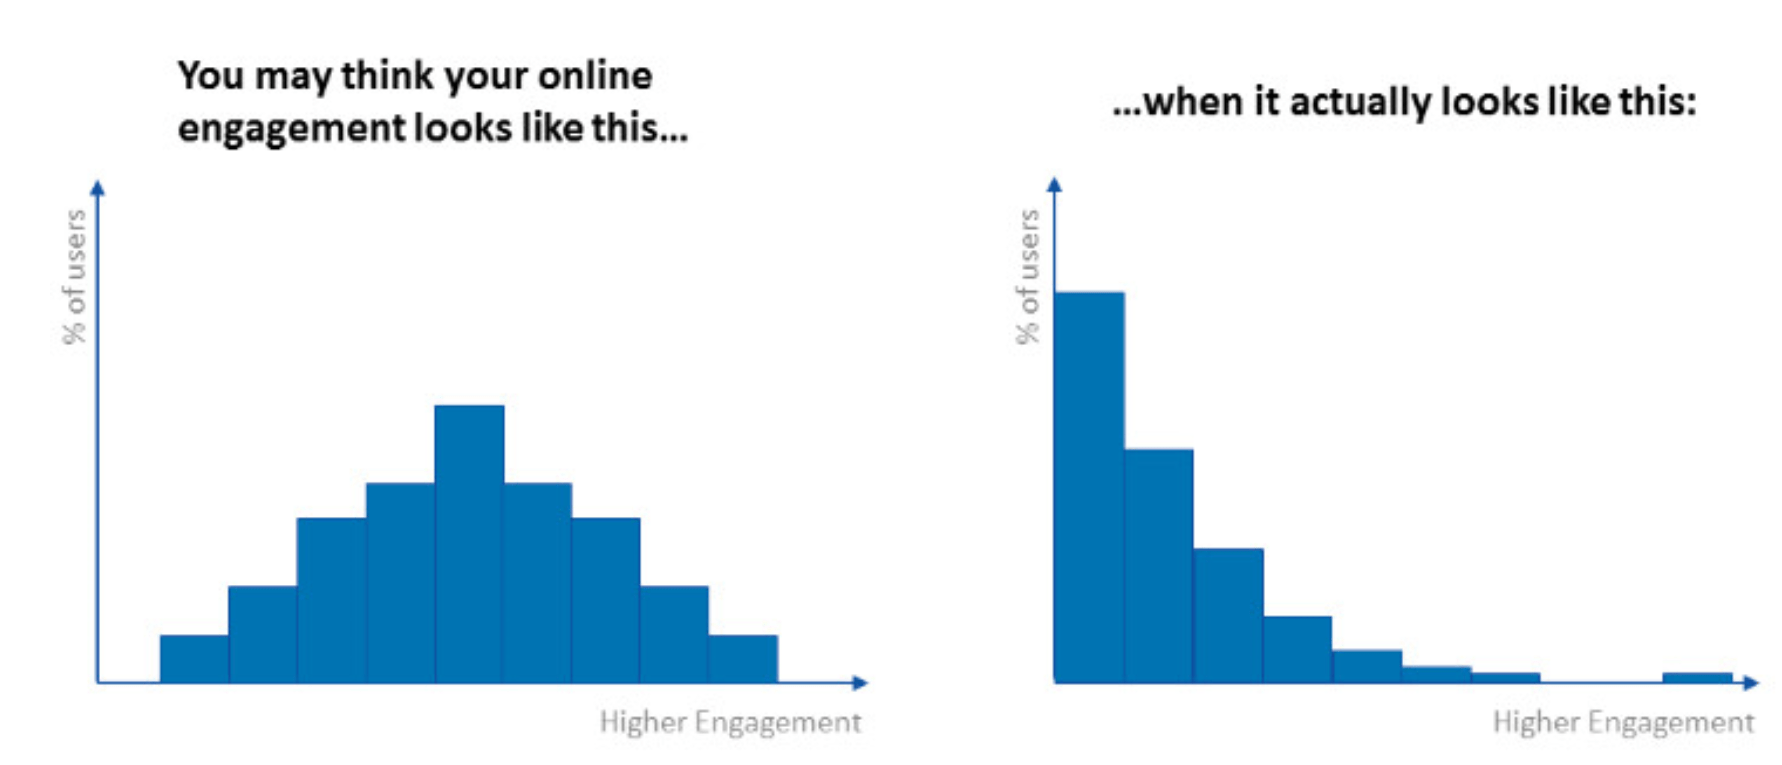
As an example, we can look at GitHubs user engagement data: In 2015, the average active GitHub user pushed code to the repository ~24 times / year. Without additional detail, it is easy to imagine that most users pushed code between 20 and 30 times, with roughly half the users pushing more and roughly half the users pushing less, but what emerges in the distribution is a completely different picture:
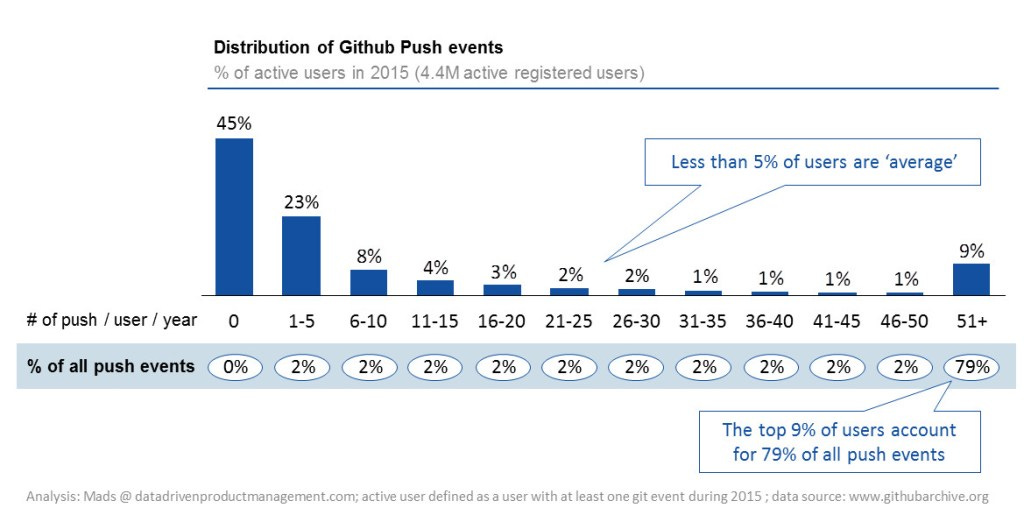
Distinct cohorts emerge in the histogram, most notably the 45% of users that did not push any code at all and the 9% of users that pushed more than 51 times. The latter cohort accounts for 79% of all push events in 2015. The ‘average user’ turns out to be a minority: Only 4% of all users push code between 21-30 times/year.
In consulting, we often use the Pareto principle of ‘80/20’, meaning 80% of the activity is accounted for by 20% of the users. However, online user engagement can be even more lopsided. In the case of Github, the top 1% of users account for 45% of all push activity and the top 0.1% of users account for 17% of all push activity. When it comes to online behavior, ‘45/1’ is the new ‘80/20’.
So what does this mean for your product strategy?
Instead of designing your product to the ‘average user’, you have to identify the key usage cohorts and tailor your product strategy accordingly. In the extreme, you will have two cohorts:
The long tail of highly engaged users (e.g., the extreme bidders at Lauritz.com or the top 1% of code pushers on Github)
The unengaged users (e.g., the 45% of Github users who did not have a single push event in 2015)
For the long tail of highly engaged users: Are these your most valuable users or your worst offenders?
Establish what the high engagement users are trying to do through further analysis or interviews and make up with yourself if the behavior is in line with your vision for your product. In marketplaces, like Laurtiz.com or Github, one approach to establishing if the behavior is ‘good’ or ‘bad’ is to look at the amount of value created on the other side of the marketplace. Specifically, how many downloads are generated by the code uploaded by the top 1% of GitHub code pushers.
If you find that the highly engaged user behavior is good, then you need to account accordingly in your roadmap prioritization. Even though the cohort may be a minority, you want to prioritize features for this cohort if they deliver a lot of value to your product. The behavior itself may provide a good initial idea of features that would be valuable, e.g., Lauritz.com could consider investing in features for large-scale batch bidding.
If you find that the long tail of highly engaged users are your worst offenders, then you can curb the usage. The curbing does not have to be a hard cut-off: You could establish paywalls at high levels of usage, which will likely both curb usage and allow you to extract value from the high engagement.
For the unengaged users: How far did they get in your product?
For the users who did not engage at all, you need to pinpoint exactly where they disengaged from your product. A funnel of the the activity leading up to that engagement can be helpful to reveal where your product might be falling short (did they discover your most valuable feature)? In the case of Github code push, one could establish how many of the users created an account, how many set up a local repository, how many forked a branch of code, etc. Product improvements and re-engagement campaigns should be oriented around the largest drop-offs in the funnel leading up to the desired engagement.
In summary, recognize that online user engagement can be extremely lopsided and tailor your product strategy to your largest cohorts’ activity levels instead of designing for your ‘average user’.